The Price Rate of Change indicator is a technical oscillator which is often used in the trading analysis. In our previous articles, we have already discussed what the ROC is. Today we shall talk about its usage.
Usage of the ROC Oscillator in Technical Analysis
The rate of change indicator can be used in many different ways. Our methods are made for day trading and price entry timing. The analysis methods are similar for all oscillators. You will notice this once you finish reading this article.
Want to know more about a ROC strategy? Read more on the topic: Best Rate of Change Strategies.
ROC as a Timing Tool
In trends, the most complicated thing is catching the precise moment to make profits and cut losses. For instance, to buy at the lowest point of an uptrend or sell at the highest point of a starting downtrend. The ROC indicator helps a lot here by being used as a timing assistant.
First, we shall use the ROC oscillator and MAs together. There is a 10 and 30-period MA on a daily chart. For the ROC, a 9-period setting was used.
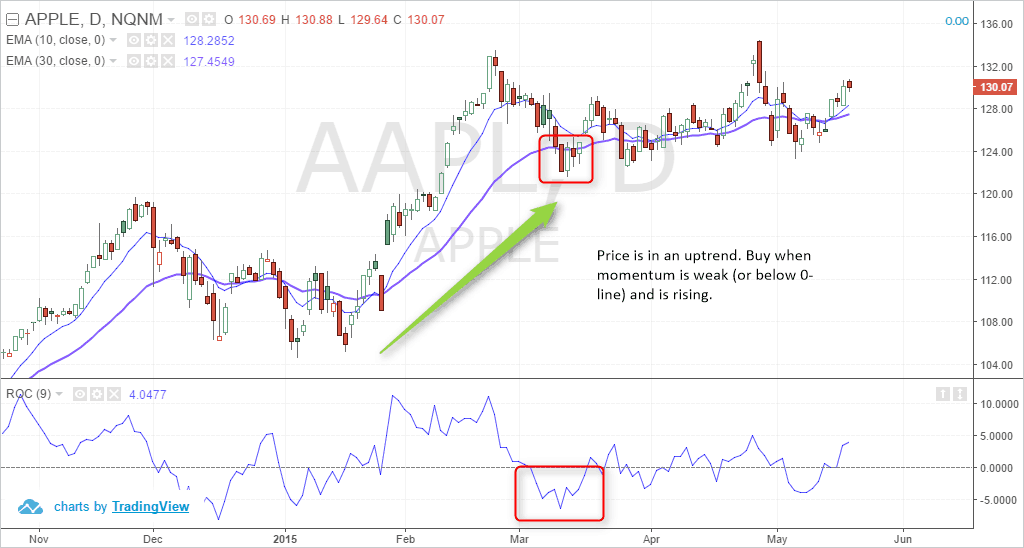
In an uptrend, wait for the weakest momentum to appear and then buy. As only the momentum starts weakening, you should sell. The red square in the picture above shows that the MAs are aligned bullishly. Here the ROC is weak. It only starts rising. This signalizes that there is a high chance for the price to go up. To get additional confirmation of the signal, you can use candlestick charts. When they form an outside bar, the signal is confirmed.
Other confirmation methods can be used too. This can be done by checking the bullishness of the fundamentals.
ROC for Divergence
All oscillators have something in common: divergence. There are many similarities that can be found once you use different oscillators. When a new low or high is formed by the oscillator but not by the price, a possible divergence is indicated.
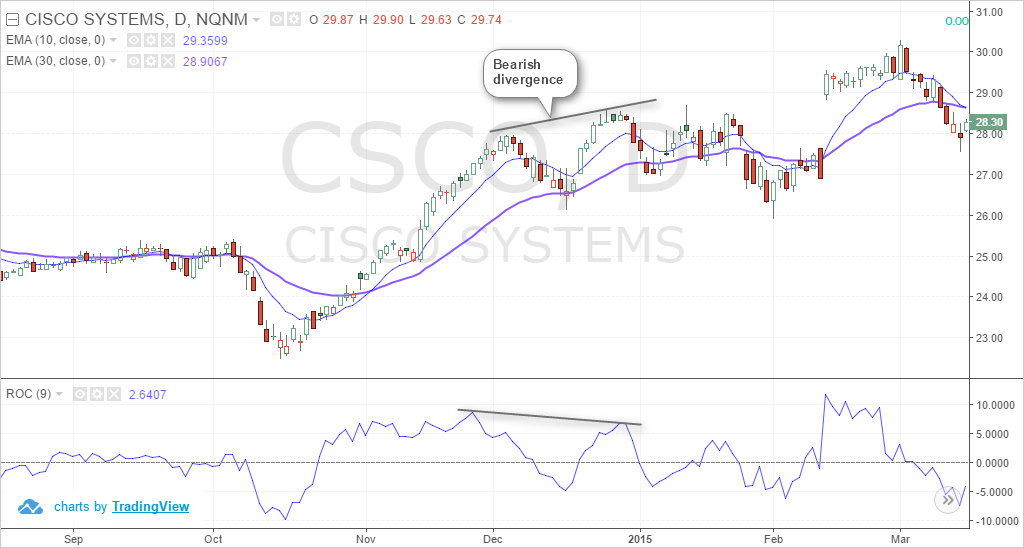
Check out the picture above. It is possible to notice the formation of divergence. In this graph, the price formed a higher high, and the ROC oscillator formed a lower high. This is called bearish divergence.
There are two options for you here:
- Go short.
- Wait for the price correction and go long.
Other types of divergence exist too, but we shall not mention them here.
ROC Breakout Trading
Usually, breakouts appear when there is strong momentum. Not all of them are successful, so the usage of the ROC oscillator will assist the trader in defining the “good” breakouts.
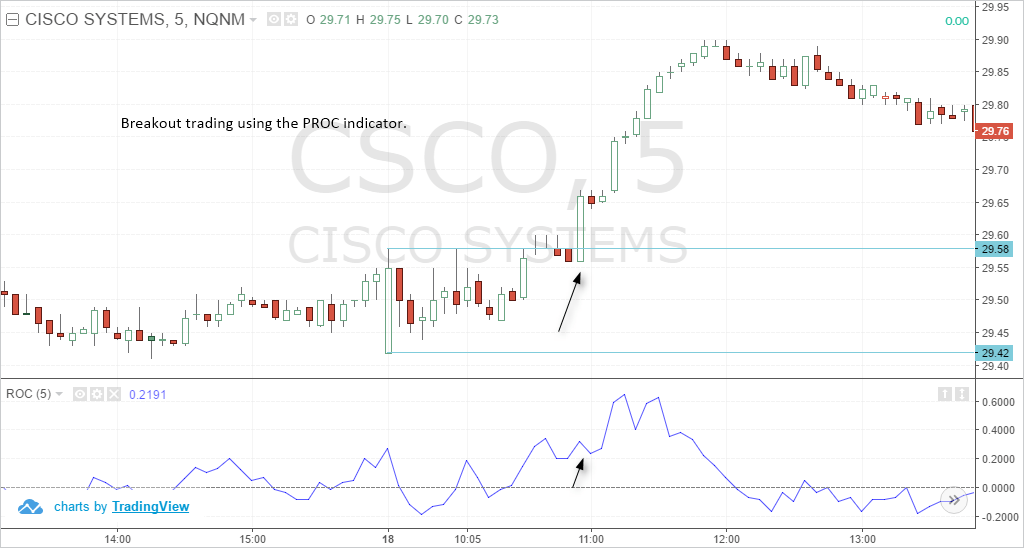
The charts above show that the price is stuck within $29.58 and $29.41 in a 5-minute time frame. Momentum is easily captured by using a 5-period look back from the ROC. Such a setting is best used to catch a breakout and make a profit of several dollars.
After making a strong breakout and getting above $29.58, the rate of change gave a signal that it is over the zero-line. The trajectory rises higher and indicates that the breakout is going to continue.
Here you can go long after the close. Do not forget to set the stop-loss to the low of the breakout. The profits depend only on you.We hope this article about the rate of change indicator was useful to you. If you have any questions, leave a reply, and we shall answer ASAP!