Believe it or not, the Fibonacci sequence has its place in Forex analysis.
Here, we will delve into how it works and how to use to use this tool when predicting stock prices.
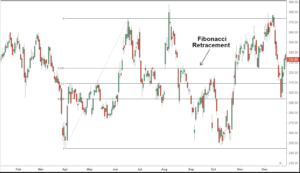
Fibonacci retracement definition
Fibonacci retracement is a term popularly used in technical analysis and is usually available in most trading and charting platforms where it can be manually adjusted on a price chart to be rendered. It employs the use of the horizontal lines to predict support and resistance levels. The common Fibonacci ratios used are 23.6%, 38.2%, 50%, 61.8%, and 78.6% which would determine the how much the chart’s initial price movement has been retraced.
How do we use Fibonacci on forex market?
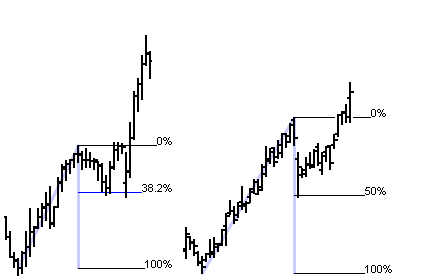
When it comes to Fibonacci, Forex traders and analysts often use in predicting stock prices by determining levels, mainly support and resistance. These are simply indicated by determining the market trend and the high and low price point and the charting platform would automatically create the levels between the points.
An example would be if a price of an asset moves from $10 to $15. These will act as points for the retracement line. Then using the ratio 23.6%, the level will point to $13.82 on the chart. A Fibonacci ratios 50% level will be $12.50.
This is calculated as so:
For 23.6% ratio;
$15 – ($5 x 0.236)
For the 50% ratio;
$15 – ($5 x 0.5)
What are the most popular strategies using Fibonacci retracement?
While Fibonacci retracements are basically just determining support and resistance levels depending on their trading style. Traders often employed this along with a countertrend trading strategy. One of the most popular strategies is called the Pullback Trade.
To do this, identify the sturdiness of a trend first. If it is a strong uptrend, determine the support and resistance levels using the ratios 38.2% and 50%.
Once the trading activity seems to be slowing or turning, it is time to enter the trade. Exit the trade once the market direction hits the same value as a recent high.
Conclusion
Fibonacci retracement is a popular tool employed to place stop-loss or target prices for trading and/or analyzing. It is better to use Fibonacci retracements with other indicators in order to maximize the potential of your analysis and earn maximum profit.
Great post. I am facing a couple of these problems.